
Equitable sharing of financial and other benefits from deep seabed mining
This page is designed to support ISA Technical Study 31. It is designed for the use of stakeholders as a convenient resource for documentation relating to the issue of equitable sharing of financial and other economic benefits from deep seabed mining, as well as a graphical interface for the model of financial payouts from a future deep seabed mining royalty fund.
MODEL OF EQUITABLE SHARING OF FINANCIAL PAYOUTS FROM DEEP-SEABED MINING ROYALTY FUND
Overview
This model is designed to support ISA Technical Study 31 on Equitable Sharing of Financial and Other Economic Benefits from Deep-Seabed Mining. That report presents and evaluates three alternative formulae for fair and equitable allocation of a notional sum of royalties available for distribution. The model should be used in conjunction with the report, which discusses in detail the formulae used. Annex 10 of Technical Study 31 also contains a detailed user manual for this model.
In this model, the three alternative formulae are named as follows:
- Original functional form (formula proposed in July 2019 report presented to Finance Committee.
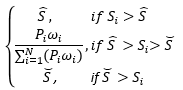
- Original form with floor and ceiling (same formula but applying the floor and ceiling as proposed in April 2020).
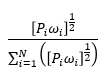
- Geometric mean functional form (as explained in Appendix 7 of the April 2020 report the geometric mean is a better way of constructing composite indices when utilizing different sorts of date and increases the overall equity of the distribution).
For comparison purposes, the model also outputs the results of distributions using unweighted populations shares, equal division and equal population weights. These are not presented as a basis for equitable distribution, but simply as a point of comparison.
Usage - Country and Group Outcome Comparisons
The tab Country_comparison is the primary product. It asks for a few basic model parameter (in the orange boxes) which are pre-filled with default options listed in the report.
The user chooses:
- Country selection (dropdown list).
- Elasticity of marginal utility of consumption (η) which is estimated to a value of 1 in the report (dropdown values from 0.5 to 2).
- Share floor which is 0.001%.
- Model share ceiling is based on 22% but maximum ISA share is 16.31% as of 2021
- A hypothetical payout, $500-million is hypothesised in the report (dropdown values from $250-million to $1-billion).
- The Atkinson inequality parameter which is usually 1 (dropdown values of 0.5, 1, and 2).
The model output:
- A country's relevant demographics including the resulting GNI-based distribution weight.
- Expected distribution shares under 3 proposed distribution functional forms and 3 comparison forms.
- Total and per-capita payouts for the selected hypothetical total payout.
- The group's Gini coefficient and Atkinson inequality index under each distributional form.
- Lorenz curves under each distributional form.
Data - Primarily World Bank and U.N. Data
All calculations are based on 5-year averages, 2015-2019, of population and GNI data unless otherwise noted. The data are also available from the World Bank, United Nations, and other sources.
Country Comparison
Please select a country
Model parameters
η
Si floor (%)
Si ceiling (%)
Payout
γ
Country Statics
| Region Group | Population | Percent of total Population | GNI per capita | wi = [G N l / G N li]n | Least Developed Country (LDC)? | Land locked Developing Country (LLDC)? |
|---|---|---|---|---|---|---|
| EEG | 28,70,166 | 0.04% | $4,790 | 3.1143 | No | No |
| Member state outcomes | Group outcomes | ||||||
|---|---|---|---|---|---|---|---|
| Share formula | Share |
Payout
(In U.S. dollars) |
Payout per capita
(In U.S. dollars) |
Gini coefficient
(Smaller values suggest more equal distribution) |
Atkinson inequality index
(Smaller values suggest more equal distribution) |
Share histogram
(Visualization of the state-level distribution of payouts) |
|
Proposed distribution functional forms |
|||||||
Original functional form |
|||||||
 |
0.0000 | $1,0000 | $0.000 | 0.000 | 0.0000 |
|
|
Original form with floor and ceiling |
|||||||
|
0.0000% | $1,37,665 | $0.0000 | 0.0000 | 0.0000 |
|
|
Geometric mean functional form |
|||||||
|
0.0000% | $1,37,665 | $0.0000 | 0.0000 | 0.0000 |
|
|
Comparison basic forms |
Unweighted population share |
||||||

|
0.0000% | $1,37,665 | $0.0000 | 0.0000 | 0.0000 |
|
|
Equal division |
|||||||
 |
0.0000% | $1,37,665 | $0.0000 | 0.0000 | 0.0000d |
|
|
Equal population weights |
|||||||

|
0.0000% | $1,37,665 | $0.0000 | 0.0000 | 0.0000 |
|
|
Functional form and comparison Lorenz curves
-
Original form
-
Geometric mean
-
Equal division
-
Equal populations
-
Original with floor and ceilling
-
Unweighted population share
-
(line of equality)
The equity assessments in this analysis - Gini coefficients, Atkinson inequality indices, and Lorenz curves, are ex-post equity between member states and not individuals. Distribution form Equal division between member states results in highly unequal division at the individual level, while Unweighted population share is the most equitable to individuals but unequal between states. Alternatives to Equal division and Unweighted population share are essentially compromises between these options.
At the state level, distributions forms Equal division, Geometric mean, and Equal populations dominate other measures (in that order when η≥1).
The crossing of Lorenz curves for distribution forms Unweighted population share, Original form, and Original with floor and ceiling suggests that no state-level dominant strategy can be chosen from among these three options.
Interpretation
Elasticity of marginal utility of consumption (usually = 1). A higher value makes the social distribution weight formula ex ante more progressive in income.
Minimum payout share (model based on floor of 0.001%).
Maximum payout share (model based on ceiling of 22% but maximum ISA share is 16.31% as of 2021).
Hypothetical total expected annual payout.
Atkinson inequality parameter (usually = 1). A higher value results in greater Atkinson index sensitivty to inequality.
Group outcome interpretations
Gini and Atkinson coefficients range from 0 (perfect equity) to 1 (no equity). The closer the coefficients are to 0, the greater the level of equity and conversely. Similarly, a Lorenz curve closer to the diagonal line of equality suggests greater equity, and conversely less equity is suggested by lines further away.